")
Alright, let’s dive into the world of Google’s G4 Analytics metrics.
Don’t worry, I’ll explain them in a way that even your grandma would understand. Ready? Here the basic metrics (explained in plain english!) you should pay attention to.

- Users: Users are the unique visitors who come to your website or app. Think of them as the people walking through the door of your virtual store. Each user is counted only once, no matter how many times they visit. So, if you’ve got 100 users, it means you’ve got 100 individual people checking out your online goodies.
- WHAT TO WATCH: New vs. Returning, Where they are coming from (aquisition)
- Sessions: A session is like a visit to your website or app. It starts when a user arrives and ends when they leave or after a certain period of inactivity. It’s like having a cup of coffee with a customer – one session is one cozy chat. If you have 500 sessions, it means your online space has hosted 500 little hangouts with your visitors.
- WHAT TO WATCH: How long are they staying, how many times are they returning. The more people return to your site is an indication of a. they might be ready to buy or b. your site is so good and full of value they use it as a resource.
- Pageviews: Pageviews tell you how many times a specific page on your website or app has been viewed. It’s like counting how many times someone flips through the pages of a book. If your “About Us” page gets 200 pageviews, it means 200 pairs of eyes have taken a peek at your company’s story.
- WHAT TO WATCH: Popular pages, how many pages they are viewing
- Bounce Rate: The bounce rate is a measure of how quickly people leave your website or app after viewing just one page. It’s like when someone enters a party, takes a quick look around, and decides it’s not their cup of tea. A high bounce rate could mean your content isn’t captivating enough to keep visitors around for the dance floor.
- WHAT TO WATCH: The bounce rate is a good indicator if your website is doing it’s job. If you have a high bounce rate, it’s time to rething your content
- Average Session Duration: This one’s simple. It’s the average amount of time users spend on your website or app during a session. Imagine you’re throwing a movie night, and the average session duration is the total time your friends spend watching the film.
- WHAT TO WATCH If sessions are short, it means they might have lost interest or found something more exciting elsewhere.
- Conversion Rate: The conversion rate is the percentage of visitors who complete a desired action, like making a purchase or filling out a form. It’s like measuring how many people go from window shopping to actually buying something. If your conversion rate is high, you’re doing a happy dance because more visitors are turning into customers.
- ALWAYS WATCH: This is the THE most important metric for your business.
- Goal Completions: Goals are specific actions you define, such as signing up for a newsletter or downloading a whitepaper. Goal completions tell you how many visitors successfully complete those actions. It’s like counting how many people successfully cross the finish line in a race. The more goals completed, the more successful your website or app is at getting people to do what you want them to do.
- WHAT TO WATCH: Goals can be set up as events.
So, there you have it! These GA4 metrics help you understand the who, what, and how of your online space. Whether it’s counting visitors, tracking pageviews, or measuring conversions, these metrics give you a glimpse into the digital world and help you make smarter decisions to improve your online presence.
The Funnel Path is GOLD! The G4 Analytics Shining Star!
Alright, let’s talk about the funnel path in Google Analytics 4 (GA4) in a way that even your tech-challenged uncle will grasp. Imagine you’re on a journey to make a peanut butter and jelly sandwich (yum!). The funnel path in GA4 is like following the steps of that delicious sandwich-making process.
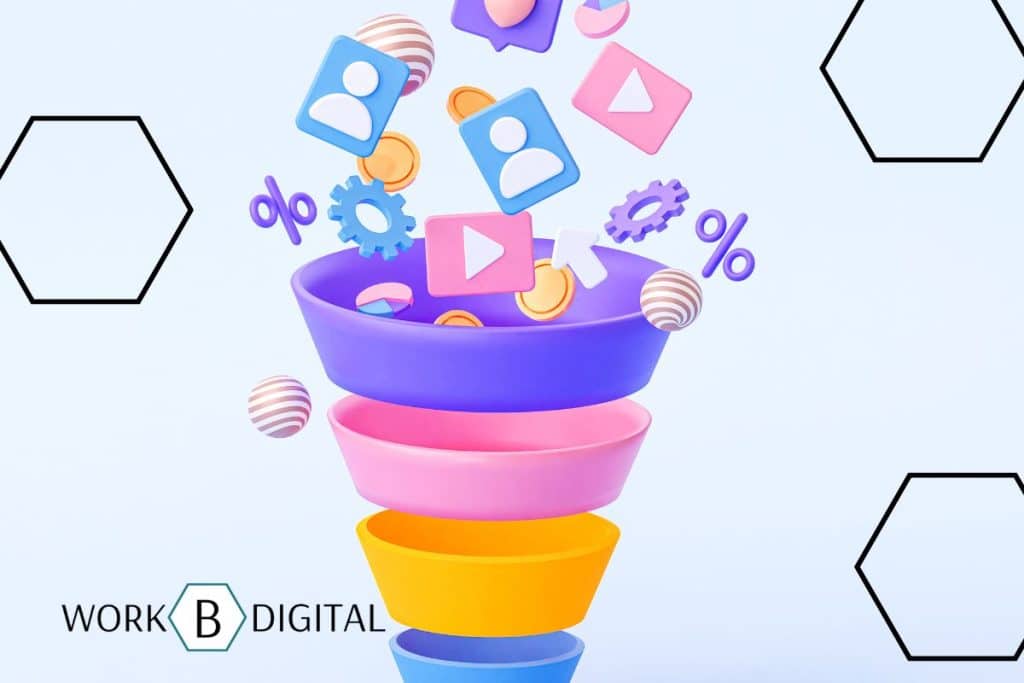
First, you start at the top of the funnel, where you have a bunch of potential sandwich-makers. These are your website visitors or app users. They’re curious, just like you when you’re feeling hungry.
As you move down the funnel, some of these potential sandwich-makers drop off. Maybe they decide they’d rather have a salad or order takeout instead. That’s okay because we’re interested in the ones who stick around.
The funnel path shows you the specific steps these engaged sandwich-makers take. Maybe they start by grabbing the bread, then move on to slathering on some peanut butter, followed by a generous squeeze of jelly. Yum! Each step in the funnel path represents a different page or action on your website or app.
But hold on, not everyone follows the exact same path. Some might skip the peanut butter altogether and go straight for the jelly. Others might add a sprinkle of honey or get fancy with some sliced bananas. That’s the beauty of the funnel path – it shows you the different routes people take on their sandwich-making adventure.
Now, here’s where GA4 becomes your trusty sous chef. It tracks the number of visitors who go through each step of your sandwich-making process. It’s like having a little helper counting how many people put peanut butter on their bread and how many move on to the next step.
With this information, you can identify any bottlenecks or areas where people drop off. Maybe your website’s bread page is confusing, or your app’s checkout process is giving folks a hard time. By understanding where people are getting stuck or leaving, you can whip up some improvements to smoothen the process and keep them on the sandwich-making path.
So, the funnel path in GA4 is like following the steps of making a tasty sandwich, tracking how many people complete each step along the way. It helps you see where people are getting stuck or leaving, so you can optimize your website or app and ensure more people enjoy the full sandwich experience.
Now, if you’ll excuse me, all this talk about peanut butter and jelly has made me hungry. Time to whip up a delicious sandwich of my own!
How to capture data for the funnel path in Google’s G4 Analytics
Alright, let’s break down how to capture data for the funnel path in Google Analytics 4 (GA4) in a way that even your technologically-challenged cousin will understand. Imagine you’re a detective trying to solve the mystery of your website or app visitors’ journey. Don’t worry, you won’t need a magnifying glass for this one!
Step 1: Set up your GA4 tracking code – Think of this as placing a special spy gadget on your website or app. This code helps GA4 keep an eye on what’s happening. You can add it to your website’s pages or include it in your app’s code.
Step 2: Define your funnel steps – Now it’s time to identify the important steps in your visitor’s journey. Just like planning your detective investigation, you need to know which clues to look for. These steps can be specific pages, actions, or events on your website or app.
Step 3: Configure your goals – Goals are like your detective’s ultimate objectives. You want to track when visitors complete specific actions, like making a purchase or signing up for a newsletter. These goals help you measure success and understand how many people are reaching the finish line.
Step 4: Set up events and conversions – Events are like little breadcrumbs left behind by your visitors. They can be actions like clicking on a button, watching a video, or submitting a form. By setting up events, you can see how many people are taking these actions and follow their footsteps.
Step 5: Explore your funnel path – Once everything is set up, it’s time to put on your detective hat and start investigating. GA4 will start collecting data on the steps and events you defined. You can then access your GA4 dashboard to see how many visitors are moving through each step, where they might be getting stuck, and how many are reaching your goals.
It’s like being Sherlock Holmes, piecing together the clues and uncovering the truth about your visitors’ journey. By capturing data for the funnel path in GA4, you gain insights into their behavior, understand where they drop off, and discover opportunities to optimize your website or app to guide them towards their destination.
So, remember, capturing data for the funnel path in GA4 is all about setting up your detective tools, defining the steps and goals you want to track, and exploring the data to solve the mystery of your visitors’ journey. Happy sleuthing!